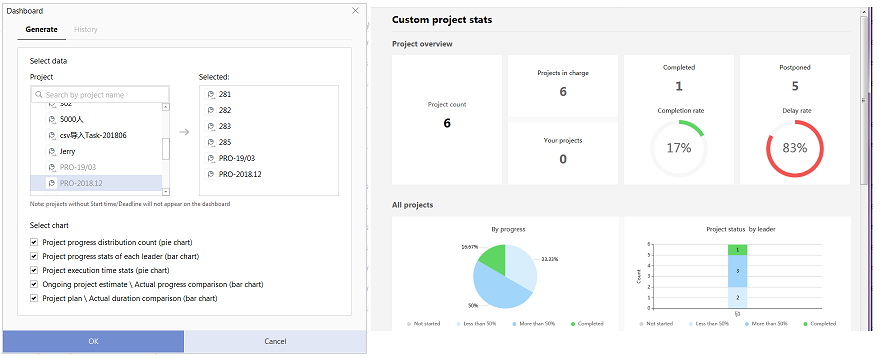
Project dashboard provides various stats, such as ⌈Personal task stats⌋, ⌈Corporate project stats⌋, ⌈Division project stats⌋ and ⌈ Custom project stats⌋.Among them, to view ⌈Corporate project stats⌋ or ⌈Division project stats⌋ needs additional permissions from TP management system administrator.

Corporate project stats
To view the dashboard needs additional permissions. If you cannot find the button, please contact your administrator.
- Select Project > Project List > Dashboard.
- In the menu, select "Corporate project stats" and open ""Corporate project stats" dashboard. The dashboard will calculate all related data of all projects, including project data led by hidden division members.
Division project stats
To view the dashboard needs additional permissions. If you cannot find the button, please contact your administrator.
- Select "Project" > "Project list" > "Dashboard".
- In the menu, select "Division project stats" and open "Division project stats" dashboard. The dashboard will calculate project data led by the specified divisions, including project data led by hidden division members.
Custom project stats
- Select "Project" > "Project list" > "Dashboard".
- In the menu, select "Custom project stats".
- In the pop-up "Dashboard" dialog box, as needed select the projects to be calculated and select the charts.
- Select "Generate" > "Select data", and select the related projects from the project list to the left.Display projects with start time and deadline only.All charts are related to the project time; projects without time cannot be calculated.
- Select "History" to show the dashboard pages generated locally; double-click to open to view it.
- Click "OK".
- The browser will automatically open the generated custom project dashboard.
- We recommend Chrome, Firefox or IE 9 and above as your web browser.
